Beginner
Type of chart
Subtopic 2 – Types of Forex Charts
Let’s take a look at the three most popular types of charts:
1. Line chart
2. Bar chart
3. Candlestick chart
Line Charts
a) Draws a line from one closing price to the next closing price. When strung together with a line, we can see the general price movement of a currency pair over a period of time.
Here is an example of a line chart for EUR/USD:

Bar Charts
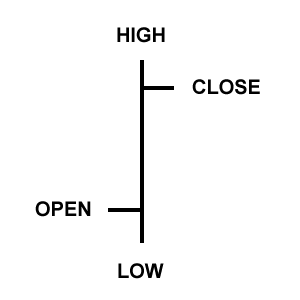
a) Bar chart also shows closing prices, while simultaneously showing opening prices, as well as the highs and lows.
Here is an example of a bar chart for EUR/USD:


Open: The little horizontal line on the left is
the opening price
High: The top of the vertical line defines the highest price
of the time period
Low: The bottom of the vertical line defines the lowest price
of the time period
Close: The little horizontal line on the right is the closing
price
Candlestick Charts
a) Candlestick charts show the same information as a bar chart, but in a prettier, graphic format.
b) If the block in the middle is filled or colored in, then the currency closed lower than it opened.

Here is an example of a candlestick chart for EUR/USD. Isn’t it pretty?

· Candlesticks are easy to interpret, and are a good place for a beginner to start figuring out chart analysis.
· Candlesticks are easy to use. Your eyes adapt almost immediately to the information in the bar notation.
· Candlesticks and candlestick patterns have cool names such as the shooting star, which helps you to remember what the pattern means.
· Candlesticks are good at identifying marketing turning points – reversals from an uptrend to a downtrend or a downtrend to an uptrend. You will learn more about this later.


 留言列表
留言列表
